
Unleashing the Power of JMeter for Load Testing
Unleashing the Power of JMeter for Load Testing
Master Apache JMeter for load testing! Learn setup, advanced features, and tips to optimize performance for web apps, APIs, and services under traffic.
Technology
January 23, 2025

Ashfat Al Rashid
SQA Engineer specializing in backend testing, API automation (RestAssured, Postman), and test automation with Java. Proficient in UI automation (Selenium, POM) and performance testing (JMeter). Experienced in manual, regression, database, and UAT testing, ensuring software quality across various platforms.

Md. Asad Chowdhury Dipu
I am a mobile app developer specialized in Native Android and Flutter, with a keen focus on building applications that stand out for their intuitive design and superior user experience. My expertise extends into the realms of data science and backend technologies, complemented by a rigorous approach to testing, including automated and manual methods, to ensure the highest software quality.

In the fast-paced world of software development, ensuring your application can handle the load is crucial. Performance matters more than ever, whether it’s a web application, an API, or a mobile backend. I’ve spent one year as an SQA Engineer working on various testing tools, but JMeter has been one of my go-to tools for load and performance testing.
Today, I want to walk you through the basics of JMeter and share my experience on how it helps to simulate real-world usage, ensuring applications can withstand traffic surges.
Why JMeter?
Apache JMeter is an open-source tool designed for load testing and measuring the performance of web services. Unlike other tools, JMeter allows you to test a variety of applications such as websites, REST APIs, SOAP services, and even databases. It’s simple to get started with and offers powerful features for professionals who need deeper insights.
The reason I like JMeter is its versatility. Whether you’re load-testing APIs or putting your website through the paces, it offers an intuitive interface with the depth needed for complex testing scenarios.
Getting Started with JMeter
1. Download and Installation: You can easily download JMeter from Apache’s official site. Since it’s built on Java, make sure your system has the latest Java version installed. Once downloaded, extract the files and navigate to the /bin directory to launch JMeter by executing the jmeter.bat (on Windows) or jmeter.sh (on Unix-based systems).
2. Test Plan Setup: JMeter’s UI may seem a bit overwhelming at first, but it becomes easier once you get used to it. Your first step is to create a test plan. A JMeter test plan consists of various elements like Thread Groups, Samplers, Listeners, and more. Here’s a quick breakdown of some key components:
- Thread Group: Represents the number of virtual users and the rate at which they’ll make requests to your server.
- Sampler: Specifies the type of request (e.g., HTTP request, JDBC request) your virtual users will send.
- Listener: Captures the results of your test, displaying them in various formats like tables, charts, or trees.
Here is an overview of a Jmeter Home Screen with a Test Plan, Thread Group, Sampler and Listener:
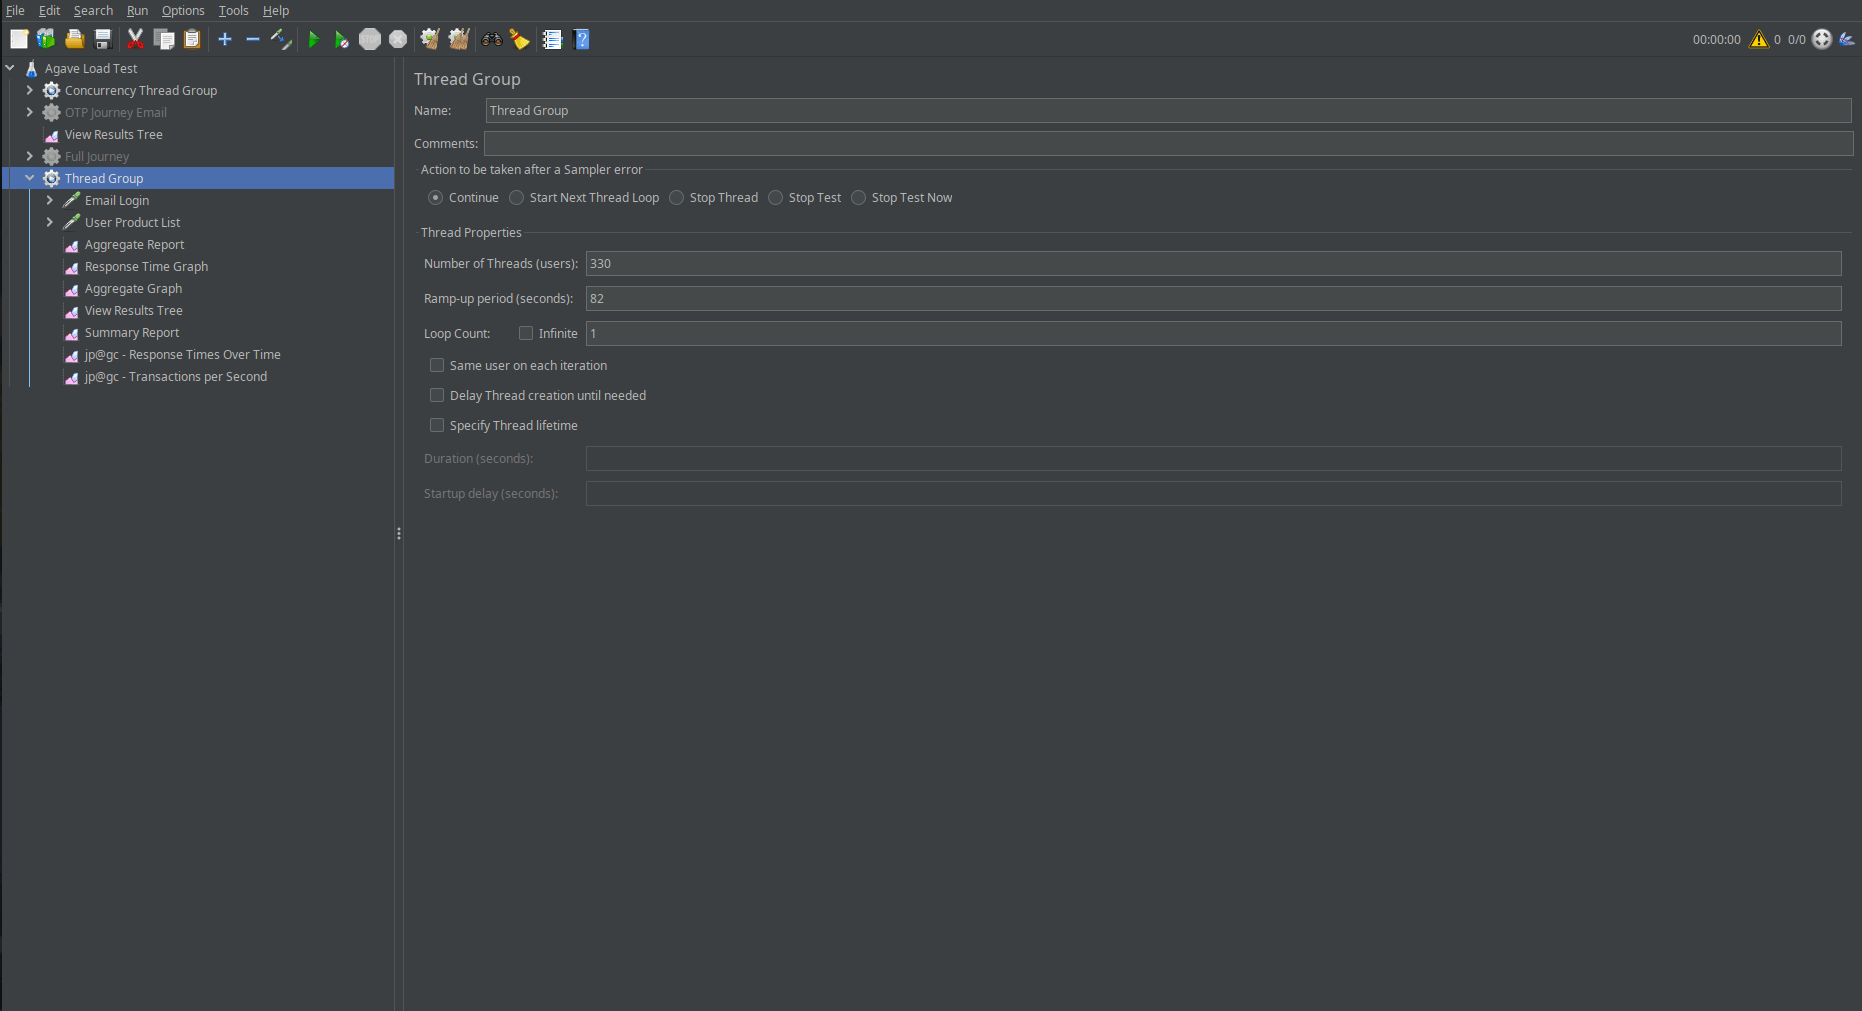
Fig 1: Jmeter Home Screen
3. Configuring a Basic Load Test: Let’s set up a basic HTTP test using JMeter. Here’s how I typically configure one when load-testing an API:
- Add a Thread Group: This controls the number of users and the ramp-up period. For example, you can simulate 100 users over 30 seconds.
- Add an HTTP Request: Provide the endpoint you want to test. In my case, when load-testing a REST API, I set the HTTP method (GET, POST, etc.) and any necessary headers or parameters.
- Add Listeners: I prefer the “Summary Report” and “View Results in Tree” listeners to quickly get insights into response times, success rates, and error rates.
Below is a basic configuration of Jmeter for load testing:
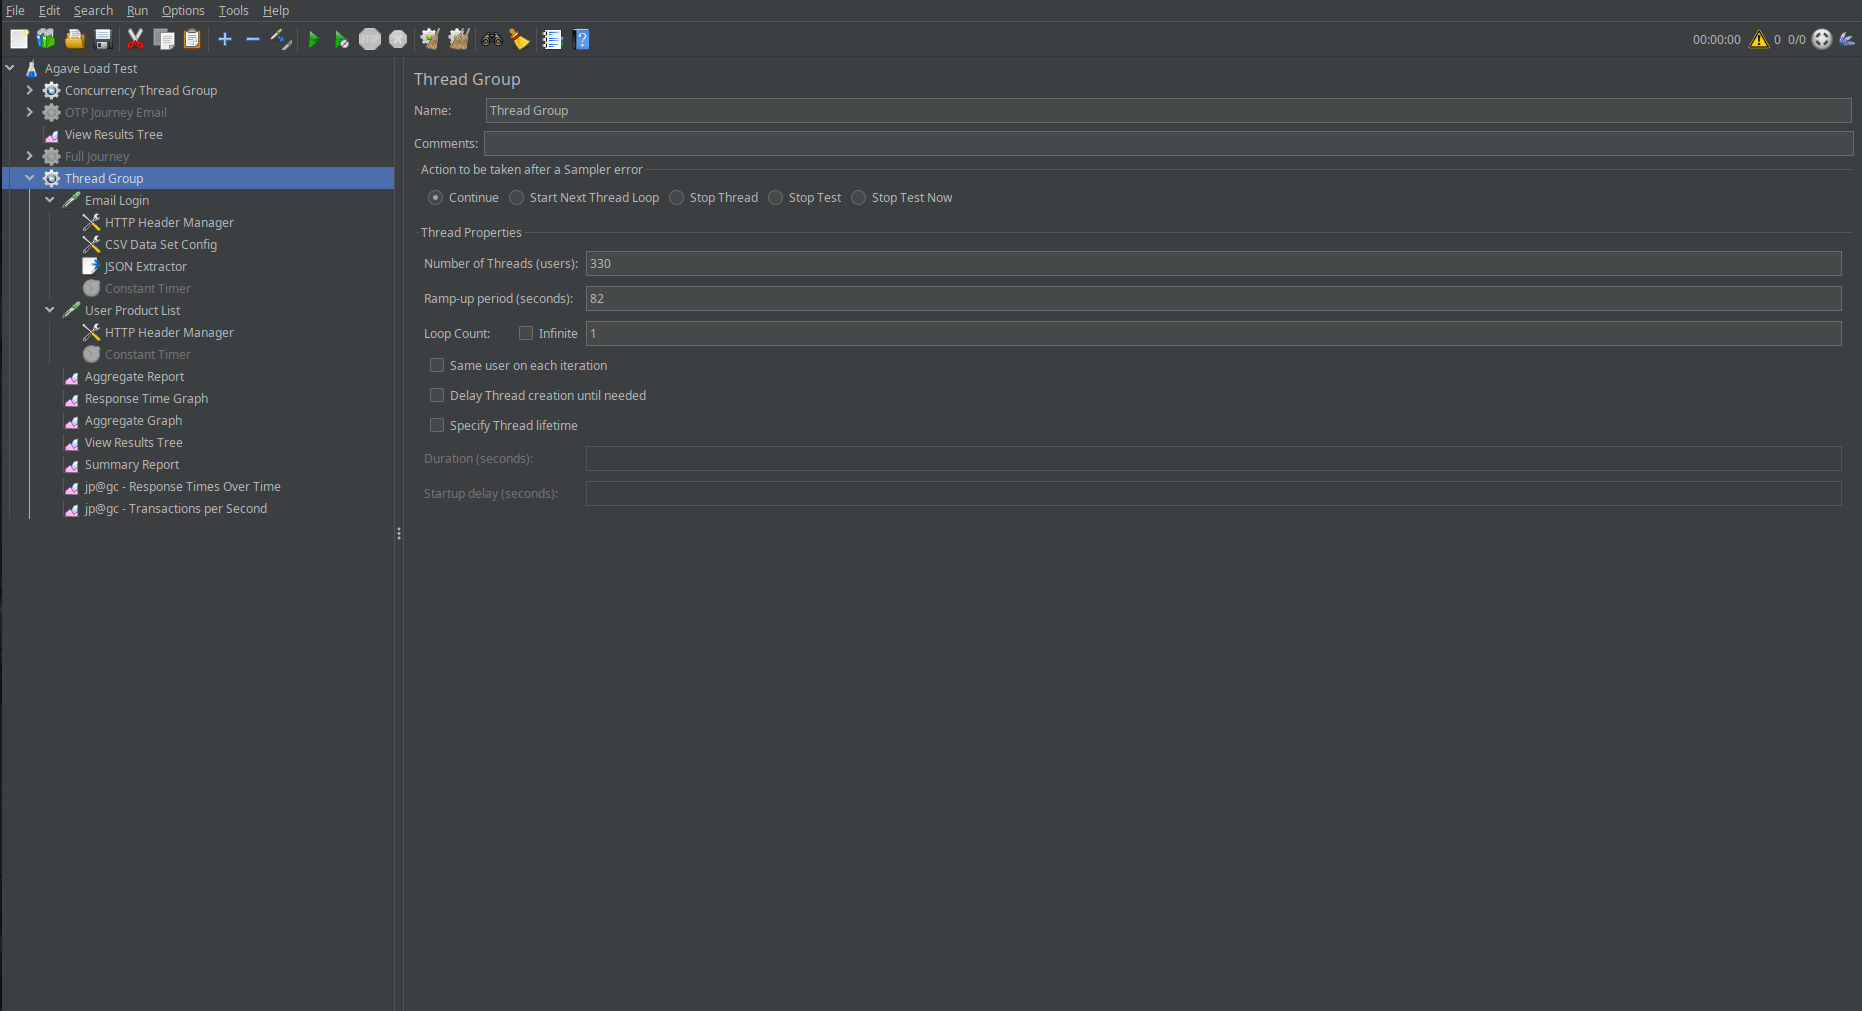
Fig 2: Configuring a basic load test in Jmeter
4. Running Your Test: After configuring your test, simply hit the start button. As your test runs, JMeter will start simulating user traffic based on the parameters you defined, and results will begin to populate in the Listeners.
5. Analyzing Results: Once the test is done, you can analyze the results. Look for:
- Response Times: How long it takes for your application to respond under load.
- Throughput: The number of requests your server can handle per second.
- Error Rates: If any requests fail, why are they failing?
In my experience, monitoring these metrics helps quickly spot bottlenecks. Recently, while testing one of our internal APIs, I found that the response time increased significantly after 500 thread users. This led us to optimize our database queries and caching strategy, resulting in much better performance under load.
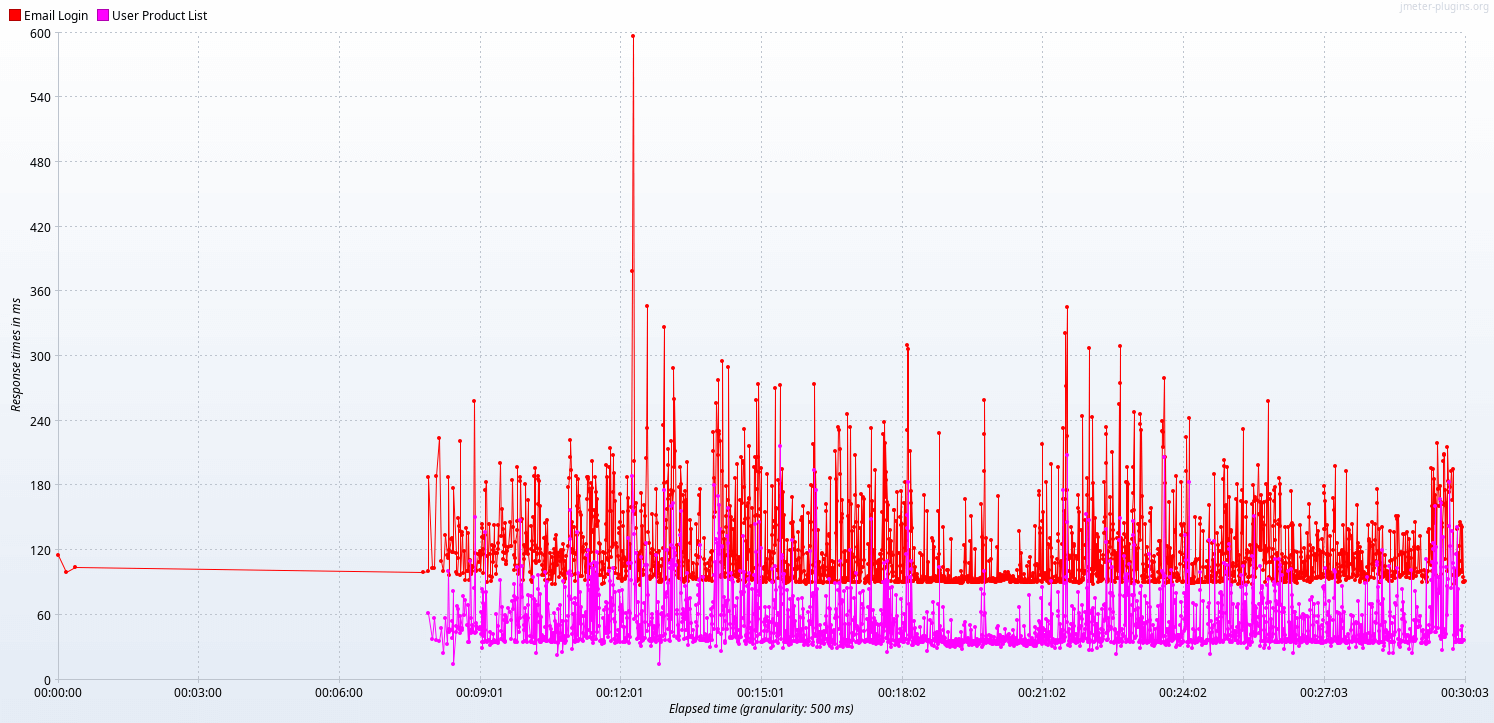
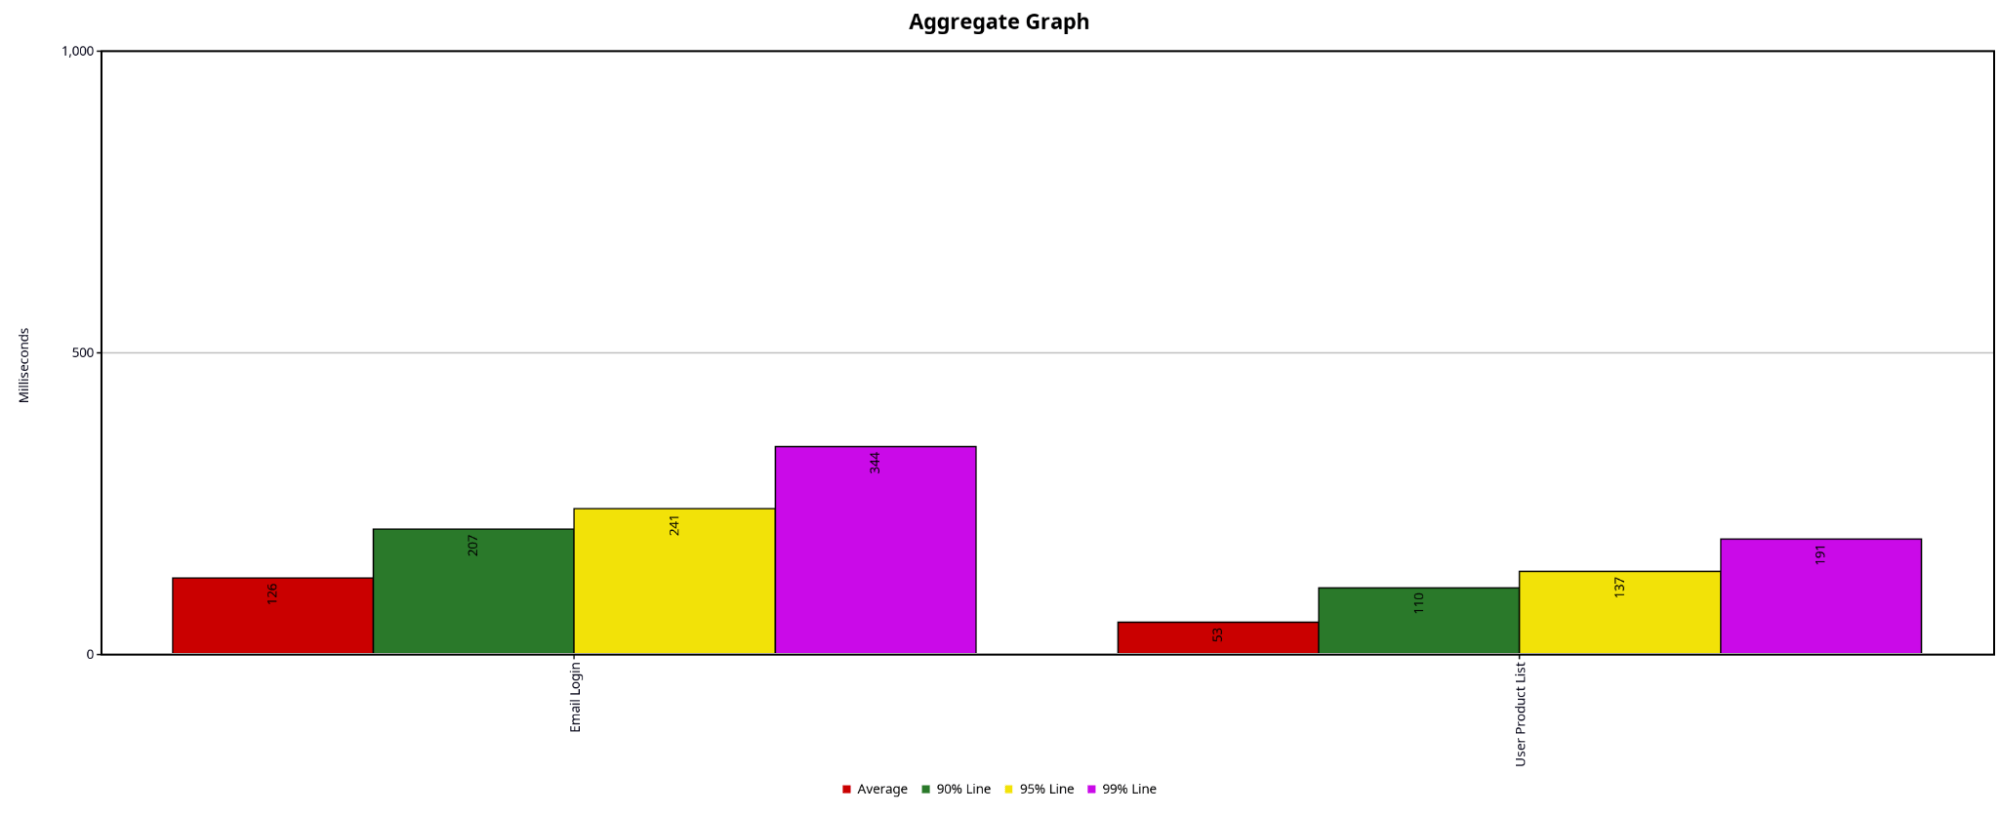
Here I’m adding some basic graphs for you to visualize the test results more effectively:
Response Time Over Time Graph:
Aggregate Graph:
Advanced Features of JMeter
Once you’re comfortable with the basics, JMeter offers more advanced features to fine-tune your testing:
1. Parameterization: By using CSV data config files, you can send different data with each request. For instance, while testing user logins, you can supply different credentials for each virtual user.
2. Assertions: These are used to validate the responses you’re getting back. For example, you might want to ensure that the response contains a specific string or that the response code is 200.
3. Distributed Testing: If you need to simulate a large number of users, you can run JMeter in a distributed mode where multiple machines generate load in parallel.
Best Practices for Effective Load Testing
Here are some best practices I’ve learned when using JMeter for load testing:
- Start Small: Begin with a small load to ensure your test configuration is correct before ramping up to more significant traffic. It avoids wasting time on misconfigurations.
- Use Assertions Wisely: While they are helpful, adding too many assertions can slow down your tests. Only add them where necessary.
- Monitor System Resources: Always keep an eye on your server’s CPU, memory, and disk usage during the test. This will help you understand what’s causing any slowdowns.
- Optimize Your JMeter Test: Disable unnecessary listeners while running large tests. Some listeners (like View Results in Tree) consume a lot of memory and may impact test performance.
Conclusion
JMeter is a powerful tool for any SQA engineer looking to ensure their applications can handle real-world traffic. Whether you’re testing a web application or a backend service, it provides the flexibility to simulate hundreds or even thousands of users. My journey with JMeter has helped me identify bottlenecks, tune system performance, and ensure our applications remain robust under heavy loads.
If you’re new to load testing, don’t worry—JMeter is beginner-friendly but grows with you as you become more proficient. So give it a try and happy testing!
We use cookies to ensure that we give you the best experience on our website. If you continue to use this site we will assume that you are happy with it.AcceptPrivacy policy